STEMsaic
Showcase |
NWACC
STEMsaic Research Impacts
NSF EPIIC Program • Award #2432716
Northwest Arkansas Community College (NWACC) Biotech Partnership Network
Supported by the NSF EPIIC Program
Enter the access password to view.

NWACC EPIIC Program Partnership Network

NSF EPIIC Program • Award #2432716 • Biotech Workforce Ecosystem, 2026
70
Partners
80
Connections
4
Spheres

Key Connections & Insights

An analysis of the Northwest Arkansas Community College partnership network, built from 60+ tagged artifacts, reports, partner lists, and grant proposals spanning NWACC's NSF EPIIC Program work. This map captures the institutional ecosystem across 9 categories and 4 EPIIC evaluation spheres.

Network at a glance

70 organizations across 9 categories

The network includes 70 organizations spanning industry, higher education, K-12, community, workforce development, government, healthcare, EPIIC program infrastructure, and the NSF EPIIC cohort. 32 nodes are confirmed through direct program evidence, 18 are inferred from regional knowledge and meeting summary analysis, and 20 are placeholder nodes awaiting verification.

80 connections with EPIIC attribution

Eighty connections link partners across the network, each tagged with the EPIIC activity or mechanism that created or strengthened the relationship, from faculty externships and micro-credential co-development to symposium co-participation and congressional visits.

~3.3% network density

With 80 connections out of 2,415 possible (70 x 69 / 2), the network has a density of approximately 0.033. This reflects the typical structure of a large partnership ecosystem where most organizations connect through hub institutions rather than directly to each other.

4 EPIIC spheres with cross-sphere bridging

Nodes span all four EPIIC evaluation spheres: Industry & Economic Development (Fortune 500 corridor plus regional biotech), Higher Education Leadership (multi-state university network), Faculty (CURE workshops, externships, micro-credentials), and Community (K-12, cultural institutions, civic organizations). Key partners like BCSI bridge multiple spheres.

Hub organizations

Four organizations emerge as structural hubs based on their connection count and bridging role across the network.

1
NWACC EPIIC Program
30 connections, central hub connecting all categories

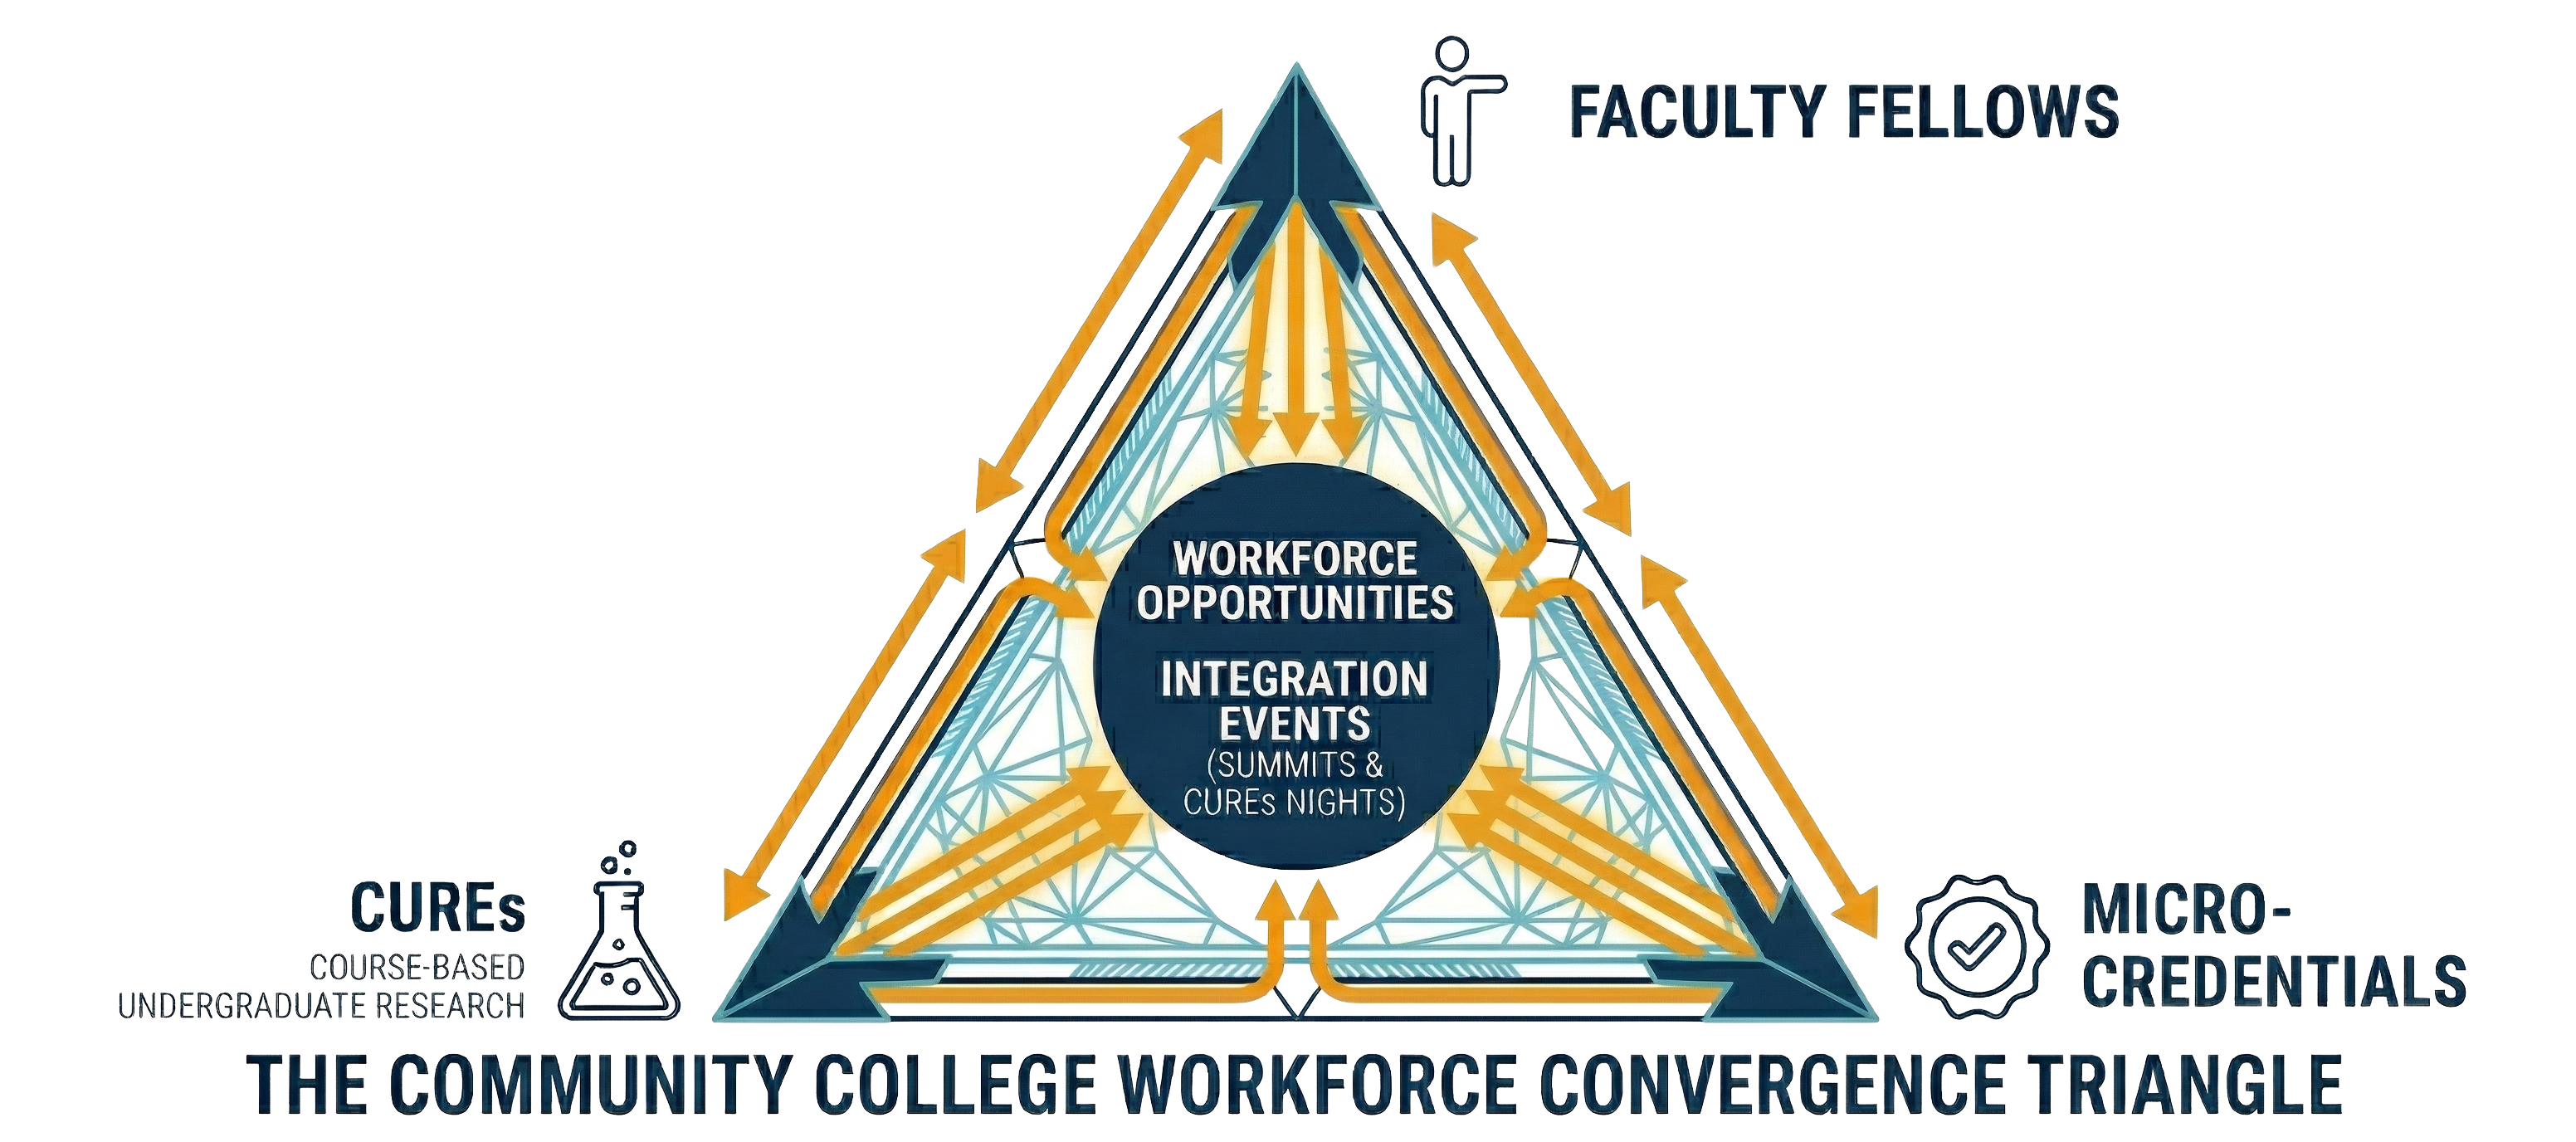
The NWACC EPIIC Program node represents the internal network infrastructure: the Community College Workforce Convergence Triangle (Micro-credential Pipeline, CUREs Coordination, Faculty Fellows) plus supporting institutional units (Grants Office, VP/Administration, Leadership & Govt Relations, Marketing, IRB, Internship Coordination). When expanded, these units connect to partners across every category, from NSF and FIPSE through the Grants Office, to industry partners through Faculty Fellows and the Micro-credential Pipeline.

EPIIC Program Industry Higher Ed Government
2
NWACC Symposium / Events
12 origin points of connectivity, primary convening mechanism

NWACC's Biotech Symposium (a half-day Y1 event, with hopes to expand to a two-day format in future years) connects industry partners, regional universities, community organizations, and vendors. The Chamber of Commerce, Crystal Bridges, VWR Scientific, and ULM all connect through the symposium. Canisius cited this conference model as influential in their own EPIIC work.

Industry Higher Ed Community
3
BCSI (Bioscience Core Skills Institute)
8 connections, deepest mutual-investment partner

CEO Angela Cassani's organization bridges industry, credentials, and workforce development. BCSI co-develops industry micro-credentials with NWACC, operates a talent marketplace integrated with Smart Resume and Arkansas Launch, and organized multi-state biotech meetings connecting BioArkansas and BioOklahoma. Named as NSF-Catalyzed Partner on TTP-T, TTP-E, and FIPSE proposals.

Industry Workforce Higher Ed
4
University of Arkansas
7+ connections, higher-ed anchor

Major partner across multiple dimensions: Beth's externship in molecular ecology lab, multiple departments at Symposium, VR bioreactor NSF grant collaboration, Upward Bound pipeline to NWACC, and faculty who own startups. Connected to MASS Center, ARA, and state higher-ed coordination. Named as TTP-T partner.

Higher Ed Cohort Government

Thematic clusters

The network organizes into five recognizable clusters that reflect the NW Arkansas regional landscape and NWACC's strategic positioning.

Fortune 500 corridor

Walmart/Walton Family, Tyson Foods, and J.B. Hunt Transport, three Fortune 500 companies with headquarters in the Bentonville-Springdale-Lowell corridor. Connected through the NW Arkansas Council and Wheeler Corporation (medical manufacturing CEO expressed strong interest in NW Arkansas expansion). The Walton Foundation funds UofA's IR3 building and is referenced in the FIPSE critique. This concentrated corporate presence creates distinctive partnership potential.

EPIIC cohort network

The Cohort Hub links NWACC to Canisius University, Albion College, Roanoke College, and NSF/EPIIC. These are confirmed, documented relationships. The cohort network provides cross-institutional learning, shared IRB frameworks, and collective problem-solving. Roanoke co-applied for TTP-E with NWACC.

4-state bio-corridor

BioArkansas, BioOklahoma, BioKansas, and BioMissouri form a multi-state consortium with BIOTC (Oklahoma biomanufacturing training center). Angela Cassani (BCSI) initiated regional meetings in Oklahoma City. Luna Costis at BioArkansas is stationed at A-State. Kansas institutions confirmed as 2026 Summit speakers. This cluster represents an emerging regional biotech workforce development network, and NWACC is actively shaping its direction.

Higher ed research pipeline

University of Arkansas, Arkansas State, UAMS, MASS Center, MVP Center, CeBEC/ASCB, Embry, ULM, and Rose State College form an extensive higher-ed research network. This cluster includes 2+2 articulation agreements (Dean-to-Dean with A-State), cross-institutional CUREs (Embry funding bioinformatics), tissue sharing (UAMS mice livers/hearts), and NSF I/UCRC participation. CeBEC workshop led by NWACC reached 50 faculty; 9 students presented at ASCB Philadelphia.

Community and K-12

Crystal Bridges Museum (Walmart-founded cultural anchor with The Momentary), Bentonville Chamber of Commerce, Local Recycling Center (organic biocomposting partnership), and Upward Bound/TRIO (1/3 to 1/2 of students attend NWACC first). The Recycling Center represents an organic, community-embedded partnership with CURE and internship potential.

Regional biotech industry cluster

A group of invited and potential partners represents NWACC's expanding industry reach: PelFreez (biological products), NowDX (diagnostics), Namida Lab, SFC Fluidics (microfluidics), Nanomatronix (nanotechnology), Biotech Pharmacal, Lineus Medical (medical devices), Berries Unlimited (agriculture/biotech), Zystein, OurPharma, George's, Simmons Foods, and Cargill. The healthcare sector adds NWA Pathology, Highlands Oncology, Mercy Hospital, and Washington Regional Medical. These potential partners signal the breadth of the regional biotech ecosystem available to NWACC.

Data collection priorities

Verification milestone: April 17, 2026 symposium

The upcoming NWACC symposium presents a natural opportunity to verify connections, identify missing partners, and collect co-participation data. Event observation, informal conversations, and a partnership mapping activity could convert many inferred connections to confirmed status.

Highest priority gaps

Healthcare sector depth. Four healthcare nodes (NWA Pathology, Highlands Oncology, Mercy, Washington Regional) are all placeholders. Allied Health interest in EPIIC fellowship suggests deeper connections exist but are not yet documented.

Community organization specifics. The community sphere has strong confirmed anchors (Crystal Bridges, Recycling Center, Chamber) but lacks the civic and cultural organizations serving NWACC's diverse student body, particularly the Marshallese and Hispanic/Latino communities.

Invited partner activation. Many industry nodes (PelFreez, NowDX, Namida, etc.) are listed as invited or potential. Tracking which attend the 2026 Summit and which develop active relationships will clarify this cluster.

Internal department connection mapping. The NWACC EPIIC Program internal network captures multiple units, but edge routing to specific departments (vs. the institution as a whole) needs verification from Dr. Gary Bates and Dr. LaShall Bates.

Degree centrality rankings (top 20)

OrganizationCategoryConfidenceConnections

About This Sociogram

A guide to the network analysis methodology, data structures, and visualization techniques used to map the NWACC partnership ecosystem, including the tagging and mapping process and the confidence-level framework.

What is a sociogram?

The interactive network visualization on the first tab is a sociogram, a graphical representation of social relationships and connections within a defined group. The term was coined by Jacob Moreno in the 1930s as part of his development of sociometry, the quantitative study of social relationships. In its simplest form, a sociogram depicts individuals or organizations as points (nodes) and their relationships as lines (edges or ties) connecting them.

This particular sociogram depicts an inter-organizational network: the unit of analysis is the organization rather than the individual, and the ties represent partnership connections between organizations in NWACC's ecosystem.

Key distinction

A sociogram is the visual representation of a network. Social Network Analysis (SNA) is the broader methodological and analytical framework that encompasses the data collection, mathematical analysis, and interpretation of network structures. This visualization is a sociogram produced through SNA methods.

Data structure

This sociogram was built by bringing together regional knowledge from the evaluation team with systematic evidence from 60+ primary source documents. The result is a multi-layered dataset with confidence indicators that make data quality visible at every level.

STEMsaic Research Impacts developed and designed the methods to bring together the different assets of the partnership infrastructure that is developing at NWACC, tag them, interconnect them, and build this interactive visualization based on research-informed practices of network diagrams and sociograms that reveal insights into partnership ecosystems moving well beyond hub-and-spoke representations. Beyond the mapping itself, tagging the EPIIC connections in terms of development pathways matters: these processes and programmatic structures are often more important than just the partnership entities themselves. They help to illuminate how things came to be, not just that they are, and that understanding points toward the support needed to sustain them.

Node attribute table
The network includes 70 organizations, each classified by category (organizational type, determining node color), spheres (EPIIC evaluation dimensions, allowing multi-sphere membership), and confidence level (confirmed, inferred, or placeholder). This multi-dimensional classification enables richer analysis than a simple binary distinction.
Edge list with confidence and attribution
The 80 connections each carry a confidence level and an EPIIC attribution note describing the mechanism or activity that created the connection. Confirmed edges come from documented program relationships with multi-source evidence. Inferred edges are derived from tagged artifact analysis and known organizational relationships. Placeholder edges represent structurally likely connections awaiting verification.
Confidence-level framework
The three confidence levels serve as a built-in data quality indicator. Confirmed nodes and edges (solid borders, solid lines) have multi-source evidence or documented program roles. Inferred (dashed borders, dashed lines, gold tint) are logically derived from tagged artifact evidence and regional knowledge. Placeholder (dotted borders, dotted lines, coral tint) mark structural positions where organizations are listed but specific connection data is needed. Across this network: 32 confirmed, 18 inferred, 20 placeholder nodes.

Visualization method: force-directed layout

The interactive sociogram uses a force-directed graph layout algorithm (specifically D3.js's force simulation) to position nodes. This is one of the most widely used layout algorithms in network visualization and works by simulating physical forces:

How the layout works
Repulsion: All nodes repel each other (like charged particles), preventing overlap and spreading the graph out.

Attraction: Connected nodes are pulled toward each other (like springs along the edges), so linked organizations appear closer together.

Equilibrium: The simulation runs iteratively until the forces reach a stable balance, producing a layout where proximity roughly corresponds to network distance, organizations with more shared connections tend to cluster together visually.

The result is that visual clusters in the sociogram correspond to structural clusters in the data. Because the algorithm involves random initial placement, the exact layout varies each time the page loads, the structure is preserved but the orientation is not fixed.

Visual encoding

Node size = degree centrality
Larger nodes have more connections (higher degree centrality). In this network, the NWACC EPIIC Program node is the largest with 30 connections when collapsed.
Node color = organizational category
Nine distinct colors represent organizational types: teal for Connect Four cohort members, pink for EPIIC program infrastructure, green for higher education, gold for industry, orange for workforce development, blue for K-12, purple for government, mint for community organizations, and red for healthcare/clinical.
Node/edge borders = confidence level
Solid borders and lines indicate confirmed data. Dashed borders and lines (gold-tinted) indicate inferred connections. Dotted borders and lines (coral-tinted) indicate placeholder positions. This visual encoding makes data quality immediately visible.
NWACC EPIIC Program internal view
Node 100 (NWACC EPIIC Program) appears as a large node with a dashed ring. Click to open the internal network view, which shows the Community College Workforce Convergence Triangle plus supporting institutional units and select external connections. This feature lets you see either the institutional-level view or the department-level view of NWACC's connections.
Hover highlighting = ego network
When you hover over a node, the visualization highlights that node's ego network, the focal node and all nodes directly connected to it, with all other nodes dimmed.

Key SNA metrics

MetricDefinitionIn this network
Degree centralityNumber of direct connections a node hasRanges from 0 to 30 (NWACC EPIIC Program)
Network densityRatio of actual ties to possible ties80 / 2415 = 0.033 (~3.3%)
Network sizeNumber of nodes in the network70 organizations
ComponentsDisconnected subgroups within the networkOne main component (65+ nodes) + small clusters and isolates
IsolatesNodes with zero connectionsSeveral placeholder industry and healthcare nodes (invited partners not yet connected)

Whole network vs. ego network analysis

This visualization represents a whole network analysis (Provan & Kenis, 2008), the analytic focus is on the structure of the entire partnership ecosystem, including all ties among all organizations. The whole network approach reveals emergent structural properties (clusters, bridges, isolates) that are invisible from any single organization's perspective.

The network combines researcher-assembled scaffold elements with extensively documented participant-reported connections, creating a hybrid that progressively converts outsider estimates to insider-verified data as primary sources are processed.

Limitations and considerations

Mixed confidence levels. While 32 nodes are confirmed through multi-source evidence, 20 remain as placeholders. The confidence level indicators make this distinction visible throughout. Density and centrality metrics will shift as placeholder connections are verified or removed.

Binary ties only. The network records only whether a connection exists or not. It does not capture tie strength, tie type (funding, referral, co-programming, etc.), or directionality. A weighted or multiplex network analysis would reveal richer structural dynamics.

Snapshot, not longitudinal. This represents the network at one point in time. As primary data is collected through team interviews, surveys, and event observation, the network will be updated at multiple time points to track growth and evolution.

NWACC not shown as a separate node. Northwest Arkansas Community College is the central institution connected to all partners shown here. Instead of a single node, NWACC is represented through the NWACC EPIIC Program node (node 100), which opens into the internal network view showing the Convergence Triangle plus supporting units and select external connections.

Suggested references

  • Moreno, J. L. (1934). Who Shall Survive? The origin of the sociogram concept.
  • Freeman, L. C. (1979). Centrality in social networks. Social Networks, 1(3), 215-239.
  • Wasserman, S., & Faust, K. (1994). Social Network Analysis: Methods and Applications. Cambridge University Press.
  • Provan, K. G., & Kenis, P. (2008). Modes of network governance. JPART, 18(2), 229-252.
  • Borgatti, S. P., Everett, M. G., & Johnson, J. C. (2018). Analyzing Social Networks (2nd ed.). SAGE.
  • Scott, J. (2017). Social Network Analysis: A Handbook (4th ed.). SAGE.
STEMsaic Research Impacts
NSF EPIIC Program Partnership Network Analysis • STEMsaic Research Impacts

Understanding Partnership Networks

Connections can be measured in many ways, and the number of connections is just one starting point. STEMsaic Research Impacts develops interactive network analysis tools to help organizations see, understand, and strengthen their partnership ecosystems.

STEMsaic Research Impacts Network analysis developed by STEMsaic Research Impacts

Why map your network?

Most institutions know they have partnerships, but few can see the full picture. A network map transforms scattered knowledge into a shared, interactive view of who connects to whom, where the clusters form, and where the gaps live. It becomes a strategic tool, not just a visualization.

This sociogram you are viewing is one example of what becomes possible when partnership data is collected thoughtfully and visualized well. STEMsaic works with institutions to design data collection activities and transform the results into interactive tools like this one.

Beyond connection counts

The number of connections is where most network analysis starts, but it is far from where it ends. STEMsaic can help your organization map networks across multiple dimensions:

🏢
Internal surveys

Map collaboration patterns within your organization. Which departments work together? Where are the silos? Internal network surveys reveal the informal structures that org charts miss.

🔗
Interdepartmental mapping

Go beyond who talks to whom. Map shared projects, resource flows, and knowledge exchange across units. Identify bridging individuals who hold your organization together.

🗺
Landscape analysis

See your institution's place in the broader ecosystem. Who are the regional players? Where do partnership opportunities cluster? Landscape maps reveal strategic positioning.

🎯
Thematic and activity networks

Map connections not just by who knows whom, but by what they do together. Shared themes, co-participation in activities, multiple factor correlations. Richer dimensions, richer strategy.

Research-informed approaches

STEMsaic's network analysis work draws on established Social Network Analysis (SNA) methodology, adapted for partnership contexts. Key measures include degree centrality, network density, clustering coefficients, and bridging analysis. We make these accessible to practitioners, not just researchers.

How STEMsaic can help

Whether you need a one-time partnership landscape snapshot, an ongoing monitoring system, or a creative data collection activity for a convening event, STEMsaic provides evaluation design, facilitation support, data analysis, and interactive visualization development. We work with your team to design the right approach for your context.

What this looks like in practice

Partnership events and convenings
Design and facilitate hands-on network mapping activities for your next partnership celebration, workshop, or stakeholder meeting. Turn a networking event into a data collection opportunity.
Evaluation and reporting
Generate interactive sociograms for grant reports, annual reviews, or board presentations. Show funders and stakeholders the evolving structure of your partnership ecosystem over time, with temporal tracking from baseline through project milestones.
Strategic planning
Use network analysis to identify gaps, bridge-building opportunities, and potential new partners. A network map is a strategic asset, not just a pretty picture. We help you read the map and act on what it reveals.

Get in touch

Interested in mapping your own partnership network? STEMsaic works with higher education institutions, research centers, community organizations, and grant-funded projects. Visit stemsaic.com to learn more, or reach out directly at partner@stemsaic.com to discuss what a network analysis engagement might look like for your organization.

How This Was Made

The story behind the NWACC Partnership Network sociogram, from a provisional 20-node scaffold to a 70-node network built from 60+ primary source documents spanning two years of NSF EPIIC Program partnership building.

The NSF EPIIC Program cohort

Northwest Arkansas Community College is one of four institutions supported in a collaborative NSF EPIIC Program (Enabling Partnerships to Increase Innovation Capacity) cohort. The cohort also includes Canisius University in Buffalo, NY, Albion College in rural Michigan, and Roanoke College in Salem, VA. Each institution carries its own individual NSF award, working in parallel to build partnership capacity in ways shaped by their distinctive regional contexts. NWACC's award is #2432716.

NWACC's context is unlike any other in the cohort. Situated in one of the fastest-growing regions in the United States, the Bentonville-Springdale corridor is home to three Fortune 500 headquarters (Walmart, Tyson Foods, J.B. Hunt Transport), a world-class cultural institution (Crystal Bridges Museum of American Art), and one of the most demographically diverse community college student bodies in the country.

From provisional scaffold to the current network

The first version of this sociogram began in August 2025 as provisional design and scaffolding, assembling an initial node set from regional knowledge, program context, and early EPIIC engagement. Individual nodes were brought in and refined over successive iterations. What you see now represents approximately the seventh version of this network, reflecting two years of continuous refinement alongside NWACC's evolving partnership infrastructure.

The current version was built from a broad set of tagged artifacts and guiding meeting summaries, partner lists, evaluation reports, grant proposals, synthesis documents, and cohort call notes spanning September 2024 through March 2026. Every named organization and documented partnership connection was reviewed for inclusion. The review spreadsheet is ongoing, full validations will be continuous, and we apologize in advance for any network connection that may be misrepresented as this work continues to develop.

How this was made

This network was built through a collaborative, ongoing process of embedded participation in NWACC's partnership operations. That includes observing and engaging with program design and development across the Convergence Triangle, contributing to internship and professional learning coordination, participating in NSF EPIIC and Department of Education proposal activities, and working alongside cross-institution reporting structures. The data comes from tagged artifacts and guiding meeting summaries spanning September 2024 through March 2026. Partnership developments are ongoing and dynamic. Dr. Gary Bates and Dr. LaShall Bates are coordinating the full EPIIC team review to verify and continue to assure the network data is current and accurate.

Categories of evidence

The expanded network draws on multiple evidence types, each contributing different kinds of partnership information:

Tagged artifacts and guiding meeting summaries (primary source). NWACC program materials from September 2024 through March 2026 provided the richest evidence: specific partner names, contact persons, activities, outcomes, and relationship progression over time. These materials captured the real texture of how partnership development unfolds at an institution.

Submission proposals. The TTP-T (Translating to Practice, Transformation) and TTP-E (Translating to Practice, Exploration) NSF submissions, along with the FIPSE Department of Education proposal, named specific partners, described their roles, and quantified partnership investments. The FIPSE proposal received a perfect score with zero weaknesses.

Partner lists and advisory records. Documented advisory board membership, symposium registrations, and industry contact lists provided the basis for many industry and workforce nodes.

Evaluation reports and synthesis documents. Cross-institutional analysis, annual report drafts, and evaluation frameworks provided the cohort-level and programmatic context for categorizing partnerships.

The EPIIC attribution framework

Every edge in this network carries an attribution note describing how the connection relates to EPIIC activities. This is not just a map of who NWACC knows -- it is a map of partnerships that the NSF EPIIC Program has created, strengthened, or catalyzed. The color of each connection line tells you the mechanism:

Faculty Fellows & experiential: Connections built directly through Faculty Fellows externships, student internship placements, micro-credential co-development, and experiential learning pathways. These are the programmatic core of the Convergence Triangle.

EPIIC-supported advocacy: Advocacy and visibility that Gary Bates, Michelle Bates, and the NWACC team can pursue because EPIIC created the platform -- Congressional meetings, White House convenings, advisory board dinners, workforce development presentations. The advocacy is theirs; EPIIC made it possible.

Capacity building: Infrastructure, curriculum, and institutional capacity built through EPIIC activities -- CUREs development, credential frameworks, T-profiling methodology, Smart Resume integration.

Event and symposium seeds: Connections formed or deepened through the Biotech Symposium and related convenings.

Proposal-enabled: Partnerships specifically formed for or through the TTP-T, TTP-E, or FIPSE submission processes.

Cohort structure: Connections through the EPIIC cohort itself -- the four institutions, NSF program office, and cross-institutional learning network.

Ongoing review and validation

Partnership development is ongoing and dynamic. A review spreadsheet was produced for the NWACC EPIIC team, and Dr. Gary Bates and Dr. LaShall Bates are coordinating full team review to verify, correct, and continuously improve the network data. Full validation will be an ongoing process. We apologize for any connection that is misrepresented and welcome any corrections.

Confidence levels

Every node and edge carries a confidence level that tells you how much evidence supports it:

Confirmed (32 nodes): Multi-source evidence from program documentation, tagged artifacts, and grant proposals. Includes all cohort members, EPIIC infrastructure, major partners like BCSI and UofA, and documented government relationships.

Inferred (18 nodes): Single-source evidence or logically derived from tagged artifact analysis and regional knowledge. Includes higher-ed institutions referenced in passing, industry partners mentioned in context, and government agencies with implied relationships.

Placeholder (20 nodes): Listed as potential or invited partners in one source, or structural positions where organizations likely exist. Includes most healthcare nodes, food processing companies, and several industry partners listed for the 2026 Summit.

The NW Arkansas landscape

Three features of the NW Arkansas landscape shaped the network's structure. First, the Fortune 500 corridor creates a concentrated industry cluster that few community colleges can match. Second, NWACC's biotech focus connects it to a multi-state bio-corridor (Arkansas, Oklahoma, Kansas, Missouri) that represents an emerging regional workforce development infrastructure. Third, NWACC's convening role, through the expanding Biotech Symposium, positions the institution as a partnership platform, not just a partnership participant.

STEMsaic Research Impacts

STEMsaic Research Impacts

STEMsaic Research Impacts provides external evaluation and design expertise and support for the NSF EPIIC Program. As a higher education and industry thought leader in partnerships coordination, science and society bridges, and research and evaluation of Science and Society Interfaces, STEMsaic developed and designed the methods to bring together the different assets of the partnership infrastructure developing at NWACC, tag them, interconnect them, and program this interactive visualization based on research-informed practices of network diagrams and sociograms. This work goes beyond simply mapping who NWACC knows. Tagging the EPIIC connections in terms of development pathways helps illuminate how things came to be, not just that they are, and that understanding points toward the support needed to sustain them.

The NWACC EPIIC team

Dr. Gary Bates and Dr. LaShall Bates lead the NWACC EPIIC program. Faculty Fellows Beth Bowles, Kate Knoll, and Matt Conyer bring the Convergence Triangle to life through externships at industry and academic partner sites, micro-credential co-development with BCSI, and the 2+2 articulation work that connects NWACC students to four-year pathways. Their work spans faculty development, micro-credentialing, biotech workforce placement, and regional partnership building through the BioConverge Summit, reflecting both NWACC's institutional ambitions and the extraordinary partnership landscape of Northwest Arkansas.

NWACC
STEMsaic Research Impacts
NSF EPIIC Program • Award #2432716 • NWACC
Welcome to the NWACC
Biotech Partnership Network

This interactive map shows the web of partnerships NWACC has built through the NSF EPIIC Program (Enabling Partnerships to Increase Innovation Capacity), a National Science Foundation initiative designed to expand, deepen, and sustain STEM partnerships between community colleges, industry, and their regional communities. NWACC is one of four institutions supported in a collaborative cohort, each working with their own individual NSF award to build durable partnership infrastructure rooted in their regional context.

Each dot on the map is a partner. Each line shows how they are connected and why, colored by the type of connection that created or sustains it. Click any dot to explore. Click the NWACC EPIIC Program node to open the internal network structure in a focused view.

The Community College Workforce Convergence Triangle
CUREs
Course-based undergraduate research experiences
Micro-credentials
Industry-validated credentials co-developed with BCSI
Faculty Fellows
Faculty externships bridging classroom and industry
Community College Workforce Convergence Triangle
Evaluation network developed by STEMsaic Research Impacts • NSF EPIIC Award #2432716